This is Part 3 of an ongoing series examining publicly available data on Federal Court decision turnaround times. Readers should look at Part 1 and Part 2 before this one.
This article focuses on decision complexity. Several readers have inquired about the perceived differences in judges’ dockets and workloads. In particular, there is a feeling that certain judges (particularly in IP) have been assigned more complex cases than others, which may explain potentially longer average writing times and inter-judge variability.
The idea that there are cases of differing complexity is intuitive – we should expect that cases have varying degrees of difficulty, at least in terms of technical and factual differences, as well as legal and procedural complexity.
Assessing decision complexity is not a novel question, but it is a hard question in practice.
At the appellate level (particularly at the Supreme Court), where data analytics has “traditionally” focused, a variety of metrics have been developed. However, many of these metrics, such as relative probability of leave to appeal, forward citations, citation “networks”, pre-appeal procedural history, number of questions in oral arguments, judge alignment patterns, and analysis of concurring/dissenting opinions)1 2 are specific to appellate level jurisprudence and not applicable to trial-level decisions.
With the currently-available data and methods, we do have some metrics that are available for analysis, specifically word count, citation count, and hearing duration. (For reasons further discussed below, while it is also possible in patent-specific cases to use a metric such as “number of patents litigated”, this measure is probably of limited statistical value given small sample sizes.)
The focus of this piece is to see whether and how much case complexity affects writing time. While these metrics should intuitively correlate with decision turnaround, a closer examination is warranted to look for trends and potential levers to improve decision delivery.
These data have historically been hard to systematically obtain and measure, and there may be inherent nuances or statistical biases within the data which will be addressed below. A more detailed discussion of data sources is included in my first post.
How much does the Federal Court write?
Word count is an imperfect but useful metric. It is imperfect because it tells us nothing about decision quality (as judges often say, more words are not always better),3 but it is useful because it is quantifiable and automatable. Word count also has the benefit of being applicable across all decisions regardless of subject area.
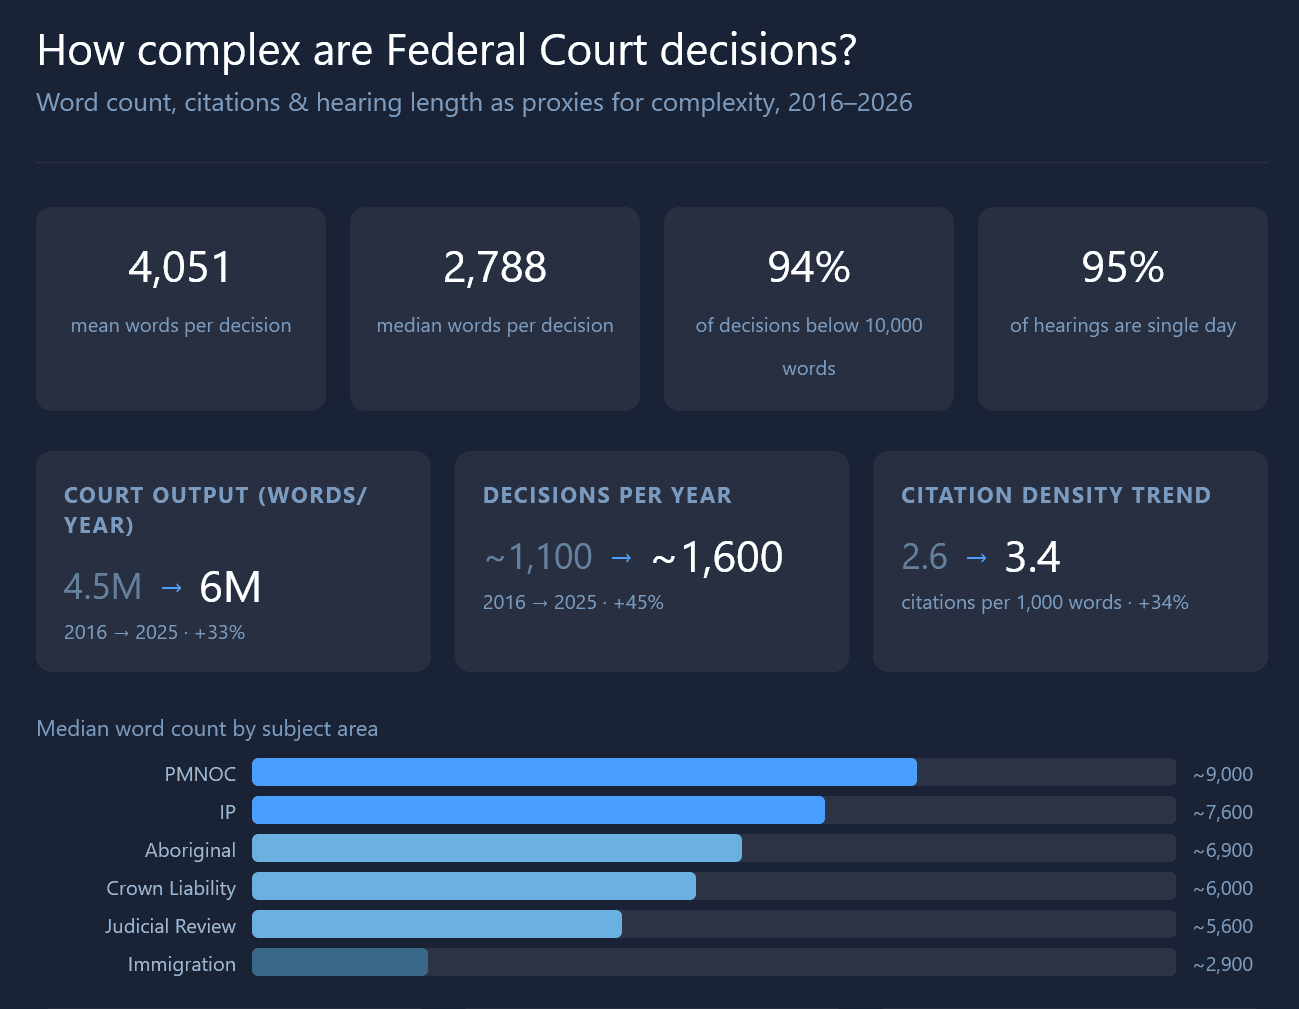
From 2016-2026, the mean word count across all decisions was 4,051 words per decision (median 2,788).
Across the Court we can see some trends in total decision word count (Fig. 1).
The overall output of the Federal Court in the last ten years, as measured by word count, has steadily increased, with minor inter-year variability. We have gone from about 4.5 million words per year to about 6 million words per year.
This is consistent with the total number of reported decisions issued by the Court over the years, going from about 1,100-1,200 to about 1,500-1,600 (Fig. 2).
In Part 2, I wrote that one potential effect of higher workloads from judicial backlog (particularly in immigration case load) is that judges might issue more decisions, but each may be shorter. While these data do not definitely prove that point, the “words per decision” trend (Fig. 3) seems to be consistent with that hypothesis.
This drop is almost entirely attributable to immigration cases due to sheer number (for example in 2025, there were 1,117 reported immigration decisions compared to 338 in all other areas). By average word count (not shown), immigration was the only subject area with a sustained fall in words-per-decision over the past ten years.
How does word count affect turnaround time?
There is a highly statistically significant positive correlation between word count and writing time, as would be expected, shown in the scatterplot below (Fig. 4).
The data are shown on a log-log scale because the data tend to be clustered at the low end on both axes (there are many more decisions distributed in the ~2,000-3,000 word range and <30 day writing time).
Doubling of word count overall is associated with about 54% longer turnaround time.
Although the relationship is statistically significant (p < 0.001, i.e. the trend cannot be attributable to random chance), the magnitude of the correlation is low at R2= 0.11. However, the data do not appear to be exactly linear – the longer tail decisions seem to take on more time as word count increases. The Spearman rank coefficient (more applicable to non-linear monotonic relationships) is ρ = +0.307, which indicates a moderate positive association between word count and turnaround time.
Interestingly, IP (R²=0.28, slope = 0.83) and Crown Liability (R²=0.19) have the strongest (and higher) word count vs. turnaround relationship. Immigration has the weakest (R²=0.06, slope = 0.56). At this low level of correlation immigration decisions are almost independent of word count. This may be due to the fact that a vast majority of immigration decisions are clustered around a shorter time (most are issued within 30 days) and are commonly written in a standard structure, so that word count is less reliable as a signal.
More notably, the trend is almost entirely driven by the top decile of cases (the 10% with the highest word count). In other words, to the extent word count is a useful proxy for complexity, it would appear that the most complex (wordy) cases not only take longer, but disproportionately longer compared to the remaining 90% of cases.
We can see this effect in a decile chart (Fig. 5A). Each point along the x-axis represents a 10% slice of decisions, ordered by word count (leftmost is the least wordy 10% of cases, and rightmost is the wordiest 10% of cases).
Rank-ordering the word count data also shows the massive variance in complexity (by word count). Indeed, 94% of decisions are below 10,000 words, even though the highest decile has an enormous range of 7,900-153,000 words. The most wordy 10% of cases are a whole order of magnitude longer than the other 90% of cases. This lends some credibility to the idea that if there is an uneven distribution of ‘complex cases’, it could potentially skew an individual judge’s docket.
If we break this down between immigration and non-immigration cases, we can also see that decision length is driven much more by top-decile word count in non-immigration cases than it is for immigration cases (Fig. 5B).
How many cases do judges cite in their decisions?
Another interesting metric is the number of cases cited per decision. CanLII’s API helpfully provides case citations (although it does not provide the full text of the judgments). However, one key caveat in the data is that the number does not capture the number of times a single case is cited-no matter how many times a case is referred to in a decision, it will only count as one unique cited case.
In comparison to word count (a very coarse measure), case citations might help us isolate legal complexity from factual complexity. For example, the number of cases cited could at first glance be related to whether there are unresolved conflicting authorities, and could be plausibly relevant to writing time based on the need to do more legal research and analysis. This is not a perfect assumption, since the number of citations may also be a stylistic choice.
Like we did for word count, we can plot citation count deciles against turnaround time to look for distinct patterns (Fig. 6).
This plot does provide an interesting insight: unsurprisingly, in non-immigration cases, citation count is positively associated with turnaround time (3.5x increase in time from D1 to D10), much like we saw for word count (Fig. 5B). However, in immigration cases, the number of citations does not appreciably affect writing time – the graph is relatively flat regardless of decile, although there is a small increase toward the right-hand side of the graph, it is much less pronounced than for word count.
This suggests (but does not prove) that factual complexity rather than legal complexity drives more of the decision-making time in immigration cases.
How many cases are cited on average in each area?
This question does not necessarily relate directly to decision writing time but is a little interesting to answer. The number of cases cited is not uniform across different subject areas (Fig. 7).
By citation count, the “heaviest” subject areas are PMNOC (and with highest variability), followed by Privacy, Aboriginal, and IP (non-PMNOC). The least “law heavy” subject area is immigration/citizenship, by a fair margin.
Citation density trends
Another way of looking at citations is the citation density, which might tell us how frequently citations occur within a judgment. The below plot (Fig. 8) shows median citation density (number of citations per 1,000 words) for each year, over time. (I would not read too much into the volatility of the “PMNOC” (red) line, because the number of qualifying cases in the dataset were very small and therefore very noisy.)
We see an interesting upward trend over the years. It is not obvious to me that the density of citations should necessarily increase over time (particularly in well-established areas of law).
One possibility is “chain-citing” (where additional authorities, especially recent ones, are used to supplement commonly-used authorities for certain propositions).
Another possibility is that, over time, judges use precedents as a shortcut to explain now-established legal tests and doctrinal discussions. Instead of explaining a test from first principles (more words), one can simply point to precedent, as intended in the common law tradition.
Indeed, when taken together with the chart above showing decision length decreasing over time, I think this is a plausible explanation. This may be useful to rebut the idea that shorter decisions are lower quality – rather, more concentrated use of legal precedent could be interpreted as a sign of a healthy legal system under the common law, and directionally positive for judicial efficiency.
Citation Trends
Finally, here is a chart of citations per decision over time (Fig. 9). The median decisions cited (black line) is effectively flat. (The median decision in any given year is almost certainly one of the 65-70% of immigration cases which have a fairly standard format.) However, the mean has been steadily increasing except for a probably COVID-related artifact in 2020 (less immigration decisions were heard and decided in 2020.) The divergence between median and mean is suggesting (but not proving) that there is an increasing “tail” of more complex decisions (at least, as measured by citation count).
Do citations correlate with turnaround time?
Across all decisions, number of cases cited is only very weakly correlated with turnaround time (Fig. 10, R2 = 0.045, slope = 0.361, in other words accounting for less than 5% of observed variance in turnaround time).
Interestingly, the correlation is much stronger in IP cases (steeper) than in other areas (R2 = 0.190, slope = 0.686 in IP non-PMNOC and R2 = 0.310, slope = 0.645 in PMNOC, both statistically significant). This suggests that judges citing more case law use additional writing time particularly in IP cases. However, this is not necessarily causal – the correlation could be a result of the inherent nature of these cases taking longer and where many authorities need to be cited to deal with each issue.
I should add that word count and number of cases cited are tightly correlated (not shown; r = 0.704, R2 = 0.496, p<0.001). There is unavoidable overlap between the two measures, since additional cases cited inevitably leads to extra word count. While they are not the same measure, they are clearly not independent variables and there may be obvious confounders. It is possible that cited cases per se do not causally drive decision-making time as distinct from word count, or vice versa.
Hearing Length / Hearing Days
One final metric we are looking at today is hearing length.
The overwhelming majority of hearings in the Federal Court take place within a single day (12,409 or 95.3% of qualifying decisions in 2015-2026). There are also a large number of decisions issued based on written submissions only with no hearings (830), mostly motions under Rule 369 and costs decisions.
Below (Figs. 11A and 11B) are the breakdowns of hearing days by subject area from 2015-2026.
Hearing length is effectively bimodal (maybe trimodal). Immigration cases (blue) make up a vast majority of single-day hearings; judicial reviews are a plurality of 2- and 3-day hearings; but 6+ day hearings were IP-dominant (green/gray), with a few lengthy crown proceedings in the mix.
Lengthy trials are relatively rare in the Federal Court, especially compared to other superior courts. Over 2016-2026, there were only 130 decisions involving 6+ day hearings (about a dozen per year), most of which are dominated by IP (including PMNOC) cases (65%). There is an uptick 10-day hearings in comparison to others, perhaps reflecting the 10-day trial cap in PMNOC cases.
Because of the bimodality of the data and relatively scarcity of long hearings, it is hard to use hearing days directly as a complexity metric or predictor of decision writing time.
For one, hearing date alone does not meaningful separate complexity within the large mass of single-day cases, and if these data are excluded, our sample size reduces dramatically.
Furthermore, since the introduction of the 10-day trial cap for PMNOC cases,4 meaningful distinctions between cases with 10-day trials has been flattened somewhat.
Finally, the number of hearing days is simply not granular enough to clearly separate the signal from the noise. While we can probably say that a 2-day hearing is “simpler” to decide than a 10-day trial, it is doubtful whether we can validly infer a 10-day trial is necessarily more complex than a 9-day trial.
Nonetheless, in the aggregate, when plotting hearing days against turnaround time (Fig. 12), there appears to be a somewhat visible upward trend, matching our intuitive expectations – naturally, the longer the trial, the more evidence that the judge will have to sift through to write their decision. But given the small sample size and limitations with this particular data set, any attempt to infer a trend using hearing length alone should be treated with caution (hence I have not included a trend line or regression values here).
In contrast to these data, interested readers should read Jon Khan’s paper analyzing similar data from BCSC (which I only discovered belatedly),5 where he concluded “court days” was the most significant predictor of “word count”, both of which were in turn significant predictors of judgment delivery time. Notably, BCSC hears many more lengthy trials than the Federal Court. In 2018 alone, BCSC heard well over 200 trials of 5+ days (compared to only 159 for the entire decade under study in the FC. The relative robustness of the BCSC data was not seen in the FC data, therefore I do not believe the results are directly comparable. However, more study may be warranted here (Khan used a potentially more robust random forest model rather than traditional statistical regression).
Hearing length trends
Separate and apart from its use as an independent predictor, hearing length trends may be able to provide contextual clues about how the Court is handling its workload.
Plotted below (Fig. 13) is the median turnaround time across the years 2016-2025 for single-day hearings (blue line) compared to multi-day hearings (red line), separated to account for the bimodality identified above. (The interquartile ranges are shaded and the difference between the two lines is the dotted line.)
It appears that decisions from single-day hearings (which overwhelmingly consist of immigration matters) are being issued faster over the last several years, while there has been an upward jump in delivery time for multi-day hearings in 2024 and 2025.
In fact, the average litigant with a single-day hearing has been receiving quick decisions (with a reasonable timeline of <30 days, and in the last two years, <20 days). The Court’s service standards have been improving on this front. Conversely, litigants with lengthier hearings (very much the minority) are seeing greater decision delays in the last two years.
While these data cannot explain the reasons for the divergence, it is useful to see the trend. There are areas of ongoing improvement at the Court which should be credited and we cannot paint the trends with a broad brush.
How is complexity distributed across judges?
We now come to the question posed by several readers: is variance between judges explainable by assignment of “harder” cases to certain judges?
While this was an intuitively straightforward question, it was hard to answer.
First, we do not have direct visibility into how cases are assigned. We do know that there are specialized “chambers” and that the Court has an informal practice of assigning same-patent cases to the same judge where possible. Apart from this, however, there are no direct data on case assignment procedure.
Second, most of the metrics we do have available are post-hoc observations and likely confounded. Worse, we have an endogeneity problem: word count and case citations are plausible proxies for complexity, but they are (at least partially) the result of the decisions under analysis, not predetermined variables. In layman’s terms, we are in danger of asking a circular question: do longer decisions take longer to write? (A better variable that is fixed before the decision is written would be the number of cases cited by the parties in their factums rather than cases cited in the decision itself. For obvious reasons this was not readily available.)
Third, and relatedly, we cannot meaningfully isolate judicial style from case complexity with our data. Perhaps some judges just like to cite more cases or write more words, and that may or may not correlate with longer writing time across judges. I make no attempt to answer this because this is not a post examining judicial style; rather we are trying to answer the question of whether controllable factors contribute to writing time.
With all those major caveats aside, an attempt was made to analyze how complexity and decision-making are related.
In the spirit of transparency, given the difficulties identified above, I asked generative AI (Claude) to provide ideas for assessing complexity metrics.
Generative AI disclaimer: The below analysis was generated with the aid of generative artificial intelligence. Specifically, Gen AI was used to brainstorm ideas for generation of complexity metrics and for development of the z-score weighting discussed below. All words are my own.
Complexity score
To look at relative variance of complexity between judges, we can generate a composite complexity metric and assign a standard score (“z-score”).
A standard-score or “z-score” is a normalized percentile-based metric for measuring how far something is from the average of any given data series. By definition, a z-score of +1 means that the measurement is one standard deviation above the mean.
The composite measure used here was based on a weighted average. Each of the decisions was assigned a score on three dimensions: word count, cited cases, and hearing days. The score is a simple percentile rank (0-100) overall or within subject area, depending on the analysis. Relative weights were given to the metrics subjectively as follows: 40% word count + 40% citations + 20% hearing days. This gave a single composite “complexity score” per decision.
Hearing days was used here despite the limitations discussed above because it did exhibit a statistically significant (but weak) positive correlation with turnaround time. More importantly, it was the only variable we have that is predetermined before a decision is written (in general but not always, trial days are set before the hearing, although judges have some control over their schedules to set longer hearings).
As noted above, ideally, we would use only predetermined variables or more robust controls to maximize validity. With more time, one additional predetermined variable that could be analyzed is the number of patents (at least for patent decisions) in each case. This variable would have the benefit of being exogenous (not determined by the judge). However, patent count may not be statistically meaningful given the small handful of multi-patent cases filed (and less decided) each year.6 Nonetheless, I cannot preclude this as a possible predictor and it may be worthwhile to follow up later.
As should be obvious, there is a somewhat unavoidable degree of circularity and a confounding variable here (judicial style or preference in writing length and hearing time), due to the metrics being used. We are limited in our ability to separate these with the existing data using traditional statistical tools, so the below analysis should be read with that in mind.
When judges’ average z-scores are plotted, we can see that there are distinct inter-judge differences. Below is a plot of IP-case specific complexity across judges (Fig. 14).
The judge with the “most complex” docket of IP cases has a z-score of +0.95, compared to the least at -0.94. This basically tracks with intuition. While the names are not shown, Judge #1 (most complex docket) decided 3 of the most “complex cases” based on our metrics (this judge heard the 1st, 2nd, and 4th longest IP trials by hearing days within the last 10 years, which were also the 2nd, 3rd, and 6th longest decisions by word count). This has a significant effect given the sample sizes involved.
The magnitude of variation (2 standard deviations from min to max) is material, but not statistically unusual. The gap is large enough to suggest that the difference in complexity is more than purely random variation. As seen in the relative differences in the bars, it does appear that there are judges who have a consistently more complex docket of cases compared to other judges.
When we plot the complexity z-score against turnaround time (Fig. 15), there is an observable positive correlation. The scale and slope here represents a noticeable 3-4 months difference from top to bottom, on average.
The trend is statistically significant: linear regression gave R2 = 0.19 (p = 0.015), and Spearman ρ = +0.45 (p = 0.012). Indeed, the correlation may be even stronger if the outliers at the top were accounted for. In any event, there is enough data to conclude that judges who have a more complex IP docket (by the proxy complexity metric) took materially longer to release IP decisions. This accounts for about 19% of variability, which is interesting but incomplete. Nonetheless, this is among the strongest signals that we have found thus far in terms of correlation to turnaround time.
Conclusions
In conclusion, case complexity when measured by word count, citation count, and hearing length, has a positive association with decision turnaround time. In very general terms, the data suggest that judges who have a docket with more complex IP matters tend to take longer to write their decisions.
However, this analysis is limited by the post-hoc observational nature of the data (word count and citation count are the output of a judge’s decision-making and not a fixed input). We therefore cannot necessarily make any conclusions regarding causality without further information.
On short hearings, notably, the Court has been improving on its delivery time for decisions, largely driven by quicker immigration decisions. However, long trials have taken more time in the past few years to be decided.
If our assumptions are valid (and they are somewhat consistent with other quantitative studies, though the caveats must be noted), the data suggests that the Court may be able to manage overall turnaround time for hard cases by a more equal distribution of complex cases, or by pre-limiting complexity (e.g. limiting the number of hearing days or issues that can be addressed in any given trial).
Upcoming
The next part will likely be the last substantive analysis in this series (for now). With additional revisions to data gathering and analysis techniques, I have been able to gain a few deeper insights into judicial workload. I will revisit some of the observations I made in Part 1, with some additional data.
Additional Notes on Sources
As mentioned above, I discussed sources in Part 1 of this series. However, additional caveats are worth mentioning here.
Word count was obtained from the raw text of FC decisions in the A2AJ dataset, which removes formatting from the raw decisions. Words were counted from the first word in the first paragraph to the last word before the judge’s signature line.
Citation count was obtained by querying the CanLII API on each decision in question. CanLII’s API is documented at GitHub.
Hearing days were obtained by a combination of text detection (on the last page of most reported decisions) and docket analysis using the Federal Court’s recorded entries. Hearing dates were often a difficult datapoint to extract due to inconsistent reporting of days on judgments (it appears different judges/registry officers have different practices – some record all dates and some record only the first or last date). Where there was conflict between the written decision and docket, the longer of the two prevailed. There may still be some inherent issues in the data. For example, some decisions such as costs and supplementary reasons may list the original trial dates as the hearing date even though further submissions were made. Where possible, especially for costs decisions, I manually recategorized the “hearing dates” to the date of last submission, or removed them from the hearing date data.
Footnotes
- Jena McGill and Amy Salyzyn, Beyond the Numbers: Statistical and Data Literacy, Domain Literacy and Supreme Court of Canada Data Analytics, 2024 115 Supreme Court Law Review 315, 2024 CanLIIDocs 3283, <https://canlii.ca/t/7nn4c> ↩︎
- Peter McCormick, “Structures of Judgment: How the Modern Supreme Court of Canada Organizes its Reasons” (2009) 32:1 Dal LJ 35, <https://digitalcommons.schulichlaw.dal.ca/dlj/vol32/iss1/2/> ↩︎
- Curtin, Alifya V. and Solomon, Lisa and Lebovits, Gerald, Ethical Judicial Opinion Writing (Spring 2008). Georgetown Journal of Legal Ethics, Vol. 21, p. 237, 2008, <https://ssrn.com/abstract=1299767> ↩︎
- Case Management Guidelines for Complex Proceedings, Proceedings under the PM(NOC) Regulations, and Appeals under Subsection 56(1) of the Trademarks Act, <https://www.fct-cf.ca/Content/assets/pdf/base/2025-07-18-Case-and-Trial-Management-Guidelines.pdf>. While PMNOC trials can be scheduled over 10 days at the Court’s discretion, this has been rare in practice. ↩︎
- Jon Khan, If I Had More Time, Would I Have Written a Shorter and Faster Decision? An Empirical Examination of the Evolution of Trial Court Decisions, 2022 45-2 Dalhousie Law Journal, 2022 CanLIIDocs 3405, <https://canlii.ca/t/7mz44> ↩︎
- In Canada there is no rule requiring a patentee to file all patent infringement claims in a single pleading. Some parties choose to file multiple infringement lawsuits for multiple patents. ↩︎
Leave a Reply